
Improving a dispersion is not simply a matter of making it thinner. The goal is controlled flow: particles should stay evenly distributed, resist settling, and move smoothly during pumping or application. As rheologist Eugene C. Bingham put it, “Rheology is the study of the flow and deformation of matter.” That principle matters when a coating drips from a brush, a pigment clumps in a mixing tank, or a slurry becomes difficult to pump.
This guide explores practical ways to Improve Dispersion Rheology, starting with measurements rather than guesswork. It considers particle size, surface chemistry, dispersant selection, solids loading, and mixing energy. Small adjustments can have visible effects. A change in dispersant dosage may reduce flocculation; excessive shear, however, can waste energy or alter the material. Temperature and storage time deserve attention too, since a sample that looks stable on mixing day may behave differently a week later.
No recipe works everywhere. The same additive can help one formulation and hinder another. That is the hard part. Bench tests should reflect real handling conditions, including rest periods and the shear rates used in production. Rheology data can guide choices, but a graph alone cannot explain every processing problem. The sections ahead offer a structured starting point, with practical tests and trade-offs to consider. Some results may be less tidy than expected—and that is a reason to investigate, not to ignore the data.
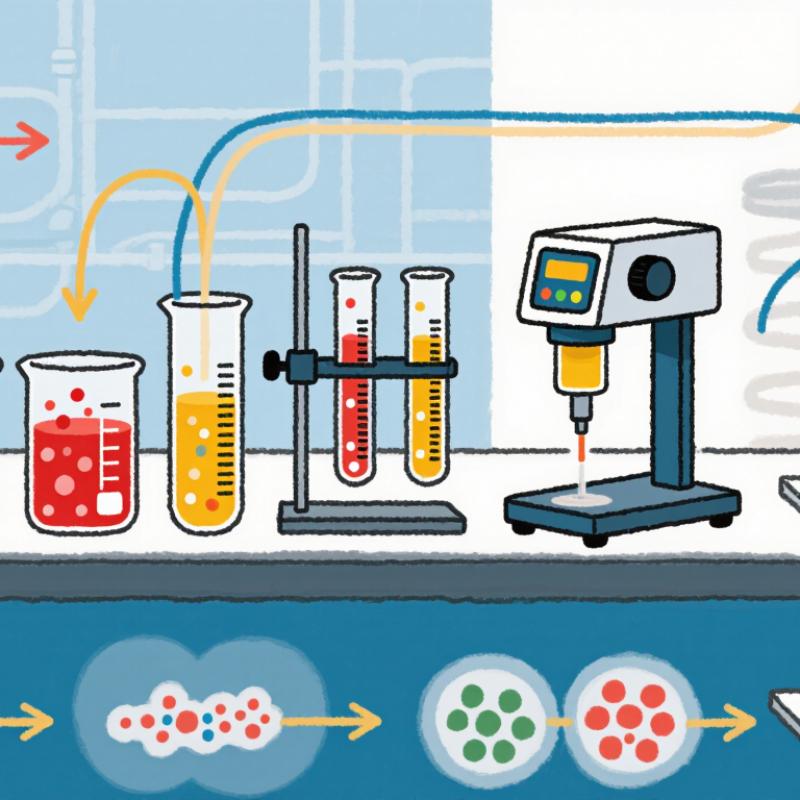
Dispersion rheology describes how a particle-filled liquid flows under changing force. Its response depends on solids loading, particle size and shape, surface chemistry, and the continuous phase. A small increase in solids can sharply raise viscosity when particles have little room to move. In the Krieger–Dougherty model, ideal hard spheres have a maximum packing fraction near 0.64 and an intrinsic viscosity of 2.5. These are model benchmarks, not universal production limits; irregular particles and broad size distributions shift the result.
Watch the shear rate. A sample may look smooth while stirring, then thicken or separate after standing. Measure viscosity across a shear-rate range, rather than relying on one spindle reading. ISO 3219-2:2021 outlines principles for rotational and oscillatory rheometry, helping labs report comparable test conditions. Keep temperature, geometry, pre-shear, and rest time consistent. Small differences matter.
Dispersant dosage is another key variable. Too little can leave particle clusters; excess may alter the liquid phase or destabilize the system. Check for a dosage plateau with small, recorded additions. Then inspect the sample after storage, not just straight after mixing. This part is easy to overlook. A clean flow curve is useful, but it cannot reveal every settling or recovery problem.

Top Ways to Improve Dispersion Rheology?
Selecting a dispersant starts with the particle surface, not the product label. Ask whether the particles are water-wettable, oil-wettable, or difficult to wet at all. The answer guides the choice between electrostatic and steric stabilization. Small trial batches help reveal whether the dispersant adsorbs effectively. Watch for persistent grit, floating powder, or rapid thickening. These are useful clues.
Dose matters. Too little dispersant can leave particle clusters intact; too much may increase viscosity or weaken the final structure. Add it gradually, then compare flow under mixing and after the sample rests. A smooth appearance is not enough. Check settling, redispersibility, and viscosity at more than one shear rate. The first choice may be wrong.
The continuous phase shapes the result just as strongly. Its viscosity can slow settling, but an overly thick liquid may hinder processing. Match polarity and pH to the particle surface and dispersant, and consider temperature changes during storage or use. Keep mixing time and shear consistent between tests. A simple record of additions and measurements often exposes patterns that memory misses. Still, lab conditions rarely capture every production variation, so confirm promising formulations at a relevant scale.
Why it matters: The continuous phase sets the baseline viscosity around dispersed particles. These approximate pure-liquid values at 20°C illustrate how strongly the choice of liquid can affect flow. In practice, select a dispersant compatible with both the particles and liquid, and evaluate the finished dispersion at the intended temperature, solids loading, and shear conditions.
Good dispersion starts with wetting, not speed. Powder added too quickly can form dry pockets that resist mixing. Feed it gradually into a moving liquid, allowing each addition to become uniformly damp before adding more. Check the vessel wall and blade: a dry ring or stubborn paste may signal poor circulation. Small details matter. Match the liquid’s viscosity and surface chemistry to the particles; otherwise, higher shear can break agglomerates temporarily without preventing them from reforming.
Measure progress instead of relying on appearance alone. ASTM D1210 describes a Hegman-type gauge for assessing coarse particles; the common 0–8 scale corresponds approximately to 100–0 μm. ISO 1524 also specifies fineness-of-grind testing. These standards offer practical benchmarks, but a grind gauge cannot describe the entire particle-size distribution or predict storage stability. The endpoint is not always obvious.
Tips: Add powder slowly, keep the blade submerged, and avoid drawing air into the batch. Record mixing time, temperature, and gauge readings. If viscosity rises sharply, pause and inspect wetting before increasing shear. Overmixing is possible—and easy to overlook.
Adjusting Process Conditions to Control Flow and Stability
A dispersion’s flow depends on more than its recipe. Mixing speed, shear duration, temperature, and ingredient order can shift viscosity and stability. Add powder at a steady rate; feeding it too quickly can create dry pockets that resist wetting. Apply enough shear to break agglomerates, then reduce intensity once the batch looks uniform. More shear? Not always. Extended high-speed mixing may heat the material, change its viscosity, or entrain air.
Control and record the processing temperature for each batch. Warming can temporarily thin a dispersion, making it seem easier to handle than it will be after cooling. Test flow under relevant conditions, such as pumping, coating, or storage—not just with one quick measurement. Let samples rest before comparing them; thixotropic systems may rebuild structure over time. A settling check helps. Test process changes one at a time, although production rarely behaves so neatly.
Tips: Keep addition rate, batch size, and temperature consistent. Record mixer speed and duration, then compare viscosity immediately and after a fixed rest. If stability worsens, revisit the latest process change; the cause may be less obvious than expected.
Testing dispersion rheology starts with a repeatable sample, not a single viscosity reading. Gently mix the container, then note the mixing time and temperature. Measure a flow curve across low and high shear rates. This shows whether the material resists settling at rest yet flows during pumping or application. If available, check yield stress and recovery after shear. Keep the measuring geometry and rest period consistent; small setup changes can distort comparisons.
Tips: Record temperature, batch age, and mixing history beside every result. Watch for bubbles or material clinging to the spindle. They can create misleading readings. Repeat the test when results look unusual.
When a dispersion thickens unexpectedly, check for evaporation, incomplete wetting, or changes in particle concentration before adding more dispersant. A sudden drop in viscosity may indicate over-dilution or excessive shear. Compare fresh and aged samples under the same test conditions, and inspect for visible lumps or sediment. One test rarely explains the whole problem. In practice, I have found that rushing sample preparation can make a stable dispersion look faulty. That is an imperfect lesson: careful notes help, but they cannot replace checking the material itself.
| Performance dimension | What to measure | Useful test conditions | How to interpret the result | Troubleshooting and improvement |
|---|---|---|---|---|
| Viscosity profile | Viscosity across a shear-rate sweep, reported in Pa·s or mPa·s alongside shear rate. | Use a rotational rheometer and a controlled temperature. A sweep spanning approximately 0.1–100 s⁻¹ can help compare low-shear structure with flow during mixing or application. | A steep viscosity decrease with increasing shear rate indicates shear-thinning behavior. Compare curves only when sample preparation, geometry, temperature, and test history are consistent. | If viscosity is excessive throughout the sweep, check solids content, temperature, agglomeration, and dispersant compatibility before changing the formulation. Adjust dispersant or rheology modifier in controlled increments. |
| Low-shear structure and yield behavior | Low-shear viscosity and, where relevant, yield stress measured with a defined stress ramp or vane-in-cup method. | Use a suitable geometry and document the rest time and ramp protocol. Avoid interpreting a single yield-stress value without the method used to obtain it. | Insufficient low-shear structure can contribute to settling. Excessive structure may make pumping, pouring, or leveling difficult. | For settling, evaluate a compatible low-shear rheology modifier and confirm that the dispersion is well wetted. For poor flow, check for flocculation or excess modifier and reassess the dispersant dose. |
| Thixotropic recovery | Viscosity recovery after a high-shear interval; report recovery at specified times and the full test sequence. | A three-interval test can use low shear, high shear, then low shear again. Keep shear rates, interval lengths, and temperature fixed between samples. | Slow recovery may reduce resistance to settling after processing. Very rapid or strong rebuilding can impair leveling or make the material harder to handle. | Tune the type and level of rheology modifier against both recovery and application flow. Confirm results with storage and application tests; recovery alone does not establish stability. |
| Particle-size distribution and coarse particles | Particle-size distribution, including D10, D50, and D90, plus a coarse-particle check where needed. | Laser diffraction results depend on the sampling and dispersion procedure. A grind gauge can screen for coarse particles or agglomerates but does not provide a full particle-size distribution. | A coarse tail or visible coarse particles can indicate incomplete deagglomeration, contamination, or re-agglomeration. Compare measurements using the same preparation method. | Check wetting, dispersant compatibility and addition sequence, milling conditions, and contamination. Verify that additional milling reduces the coarse fraction without causing overheating or unwanted changes. |
| Storage stability and redispersibility | Sediment or separation, ease of redispersion, and changes in viscosity or particle-size indicators over time. | Use sealed samples and record storage time, temperature, and any accelerated-aging conditions. Compare against a freshly prepared reference. | Hard, difficult-to-redisperse sediment can indicate strong settling or particle association. A soft sediment may be easier to redisperse, but still requires evaluation for the intended use. | Check particle wetting, dispersant demand, density differences, and low-shear structure. Do not rely on viscosity alone; verify stability under representative storage conditions. |
| Temperature and batch consistency | Sample temperature, solids content, mixing history, and viscosity at a specified shear condition. | Allow samples and measurement equipment to reach a consistent temperature. Record dilution, rest time, and mixing conditions for every comparison. | Temperature, solids variation, entrained air, and sample history can all change measured flow behavior and create misleading batch-to-batch differences. | Standardize sampling and conditioning, verify solids and temperature, and remove bubbles using a consistent procedure. Change one formulation or process variable at a time. |
For an immediate response, please call this
number08045801431
Price:
