GST : 27AAFFV7667M1ZA

call images

Call us

08045801431

What Are Control Valves and How Do They Work?

Control Valves: What They Are and How They Work

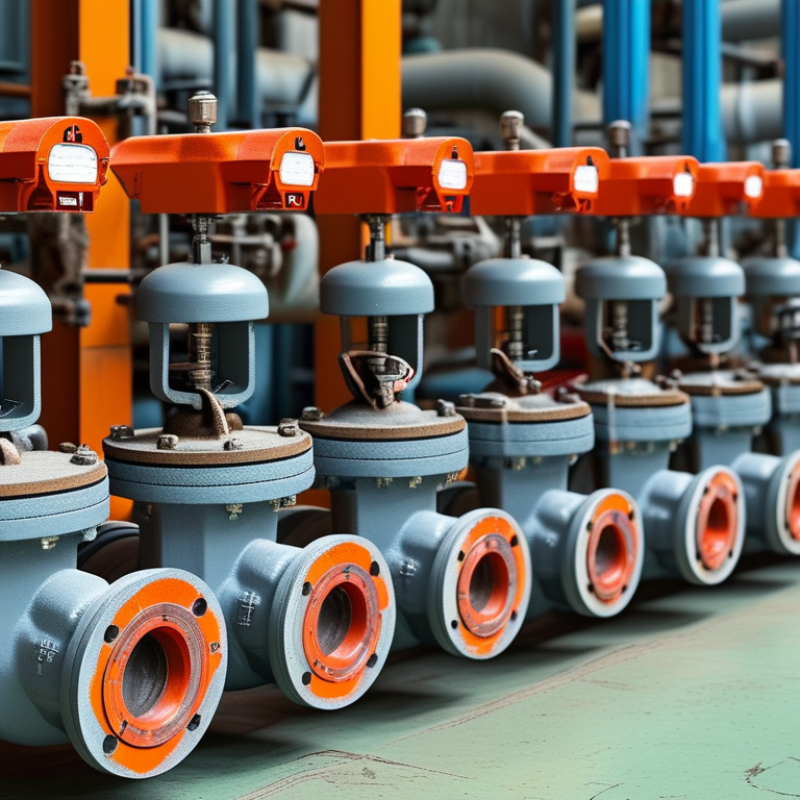
Control Valves quietly regulate pressure, flow, temperature, and liquid level throughout industrial systems. They respond to signals from controllers and adjust process conditions through mechanical movement. A valve may open, close, or hold a precise intermediate position. Small changes matter.

Béla G. Lipták, a respected process-control engineer and author of the Instrument Engineers’ Handbook, wrote, “The control valve is the most common final control element.” This observation explains its practical importance. Sensors measure process conditions, controllers compare those measurements with desired values, and Control Valves apply the correction. In a steam line, for example, a pneumatic actuator may move the valve plug while air pressure changes. The result can be a steadier temperature inside a heat exchanger.

The technology appears simple. It is not always simple.

Valve selection requires attention to fluid properties, pressure drop, material compatibility, actuator sizing, and failure position. Engineers also consider noise, cavitation, response speed, and maintenance access. In the field, a valve can look healthy while its positioner performs poorly. That mistake can produce unstable pressure, wasted energy, or unnecessary equipment wear.

This guide explains the main components of Control Valves and the signals that operate them. It also examines common valve types, actuation methods, control-loop behavior, and practical maintenance concerns. The discussion uses established engineering principles, but real installations still require site-specific calculations and qualified review. A useful explanation should remain honest: no single valve suits every process.
What Are Control Valves and How Do They Work?

What Control Valves Are: Final Control Elements Governed by ISA-75 Standards

What Are Control Valves and How Do They Work?

Control valves are final control elements in an automatic process loop. A controller sends a signal, and the valve changes flow, pressure, temperature, or liquid level. The movement may come from a pneumatic actuator, electric actuator, or hydraulic system. Simple in appearance. Critical in operation.

The ISA-75 standards series provides common language for valve sizing, capacity, performance testing, noise, and cavitation. These standards help engineers compare equipment under defined conditions. They do not replace process judgment. A valve that fits the calculated flow may still perform poorly when flashing, vibration, or unstable pressure appears in the pipe.

Field commissioning often reveals the gap between design data and plant reality. A valve may hunt because its travel range is too large. It may also lose authority when nearby piping creates excessive pressure recovery. ISA-75 testing methods give useful reference points, but installation details remain decisive.

Grand View Research valued the global control valve market at about 7.4 billion U.S. dollars in 2023, with a projected 6.1% annual growth rate through 2030. MarketsandMarkets separately projected growth from roughly 7.8 billion dollars in 2024 to 10.5 billion dollars by 2029. These figures suggest expanding demand, yet market growth does not guarantee correct application. Engineers still need accurate fluid data, realistic operating ranges, and documented testing. Some designs are still oversized. That mistake deserves more attention.
Key Components: Body, Trim, Actuator, Positioner, and 4–20 mA Signals

What Are Control Valves and How Do They Work?

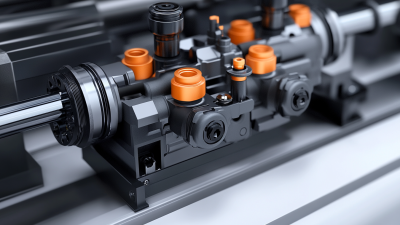
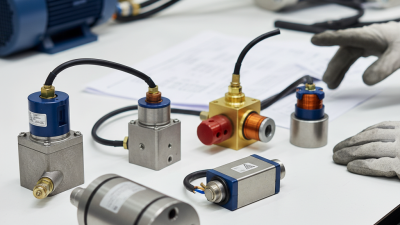
A control valve adjusts fluid flow, pressure, temperature, or level inside a process system. Its body contains the fluid and provides the pressure boundary. Inside, the trim includes the plug, seat, stem, and related internal parts. These parts determine how much flow passes through the valve. A worn seat can cause leakage, while incorrect trim sizing may create noise, vibration, or unstable control. Small details matter.

The actuator moves the valve stem after receiving a control command. It may use air, electricity, or hydraulic power. A positioner compares the requested valve position with the actual position, then corrects errors. In many industrial loops, a 4–20 mA signal carries the command. Four milliamps commonly represents the zero point, and 20 milliamps represents full scale. The positioner converts this signal into precise actuator movement. However, the signal alone does not guarantee accurate control. Calibration, air quality, friction, and linkage condition also affect performance.

Tips: Check the valve stroke before commissioning. Confirm the signal range at the terminals. Watch the stem for hesitation. A stable loop can still hide a slow mechanical problem. Do not assume a fully open valve always gives maximum flow; upstream pressure and trim design remain important. Field observations should challenge calculations, especially when process conditions change.

How Control Valves Work: From Input Signal to 0–100% Valve Travel

A control valve regulates fluid flow by changing the opening inside a pipeline. Its movement can be continuous, from 0% closed to 100% open. The sequence starts with measurement. A sensor detects pressure, temperature, level, or flow. A controller compares that reading with the required setpoint. It then sends an input signal to the valve assembly. Common signals include 4–20 mA, pneumatic pressure, or digital commands.

Inside the positioner, the signal becomes physical movement. The positioner adjusts air pressure or actuator force. This moves the stem, shaft, or rotary disc. A feedback device checks the actual position and corrects errors. At 12 mA, the valve may target about 50% travel. However, travel is not always perfectly proportional to the signal. Valve trim shape, friction, pressure changes, and calibration can shift the result. The relationship is rarely perfect. That matters during commissioning.

Tips: Confirm the signal range before testing. Check whether 0% means closed or fully open. Record actual travel at several signal points. Inspect for sticking near low openings. A valve can appear responsive while still missing its intended position. Choose a safe failure position for the process, and verify it during a controlled test. Calibration should reflect operating pressure, not only workshop conditions. Small errors can become unstable control.

What Are Control Valves and How Do They Work?

How Control Valves Work: From Input Signal to 0–100% Valve Travel

A control system commonly uses a standardized 4–20 mA signal to command a valve actuator. In a calibrated linear position relationship, 4 mA represents 0% valve travel and 20 mA represents 100% valve travel.

Control Valve Sizing: Cv, Flow Rate, Pressure Drop, and Choked Flow

What Are Control Valves and How Do They Work?

Control Valve Sizing: Cv, Flow Rate, Pressure Drop, and Choked Flow

A control valve regulates fluid flow by changing its opening area. The actuator moves the plug, ball, or disc. A controller adjusts that position from process measurements. Correct sizing begins with flow rate, fluid density, temperature, inlet pressure, and outlet pressure.

Cv is the valve’s flow coefficient. For water, Cv represents the flow in U.S. gallons per minute at a one-psi pressure drop. For example, 100 gpm through a 20-psi drop requires a calculated Cv of about 22.4. This simple result can mislead. Gas and steam calculations require absolute pressure, temperature, compressibility, and expansion factors. ISA 75.01.01 and IEC 60534-2-1 provide recognized calculation methods.

Pressure drop drives capacity, but excessive drop wastes energy and can create noise. Choked flow occurs when increasing downstream pressure reduction no longer increases flow. In liquids, flashing or cavitation may follow. In gases, sonic velocity limits the flow. The exact limit depends on valve geometry and recovery factors. Standards-based calculations are safer than copying a previous valve specification.

Field experience exposes a common weakness: engineers sometimes select a large valve for future capacity. That choice may cause unstable control at low openings. I still recheck the calculation using minimum, normal, and maximum flow cases. A 2023 industrial energy-efficiency assessment framework from the U.S. Department of Energy also emphasizes operating-condition data before equipment selection. The spreadsheet is useful, but measured process data remains better.

What Are Control Valves and How Do They Work? — Control Valve Sizing: Cv, Flow Rate, Pressure Drop, and Choked Flow
Data Dimension Service or Example Input Conditions Calculation or Technical Criterion Result Sizing or Operating Meaning
Control Valve Function General process-fluid control Valve position changes the effective flow area. Increasing the opening generally reduces flow resistance and increases flow, provided the available pressure drop is sufficient. Flow, pressure, level, or temperature can be regulated. The valve is the final control element between the process controller and the fluid system.
Flow Coefficient, Cv Water at approximately 60°F Flow rate: 50 US gal/min
Specific gravity: 1.00
Pressure drop: 10 psi
Cv = Q × √SG ÷ √ΔP Cv = 50 × √1.00 ÷ √10 = 15.8 A valve with a selected rated Cv above the calculated requirement may be needed to provide operating margin.
Cv Sizing Water-like liquid service Flow rate: 120 US gal/min
Specific gravity: 1.05
Pressure drop: 16 psi
Cv = 120 × √1.05 ÷ √16 Required Cv ≈ 30.8 The calculated Cv represents the valve capacity required at this specified flow and pressure drop.
Cv Sizing Light hydrocarbon liquid Flow rate: 250 US gal/min
Specific gravity: 0.85
Pressure drop: 25 psi
Cv = 250 × √0.85 ÷ √25 Required Cv ≈ 46.1 Lower specific gravity reduces the Cv required for the same flow and pressure drop compared with a denser liquid.
Pressure Drop Liquid control loop Upstream pressure: 10 bar(g)
Downstream pressure: 7 bar(g)
ΔP = P₁ − P₂ ΔP = 3 bar Pressure drop is the driving force for flow through the valve; it must be available without exceeding system or valve limits.
Pressure Drop Allocation Illustrative water-system design Pump discharge pressure: 8 bar(g)
Required process pressure: 6.5 bar(g)
Other piping losses: 0.5 bar
Valve ΔP = 8 − 6.5 − 0.5 Available valve ΔP = 1.0 bar Using the actual valve pressure drop, rather than the total system pressure difference, improves Cv selection.
Liquid Choked Flow Water at approximately 20°C Upstream pressure: 10 bar(a)
Vapor pressure: 0.023 bar(a)
Liquid pressure-recovery factor: FL = 0.70
ΔPmax ≈ FL² × (P₁ − FF × Pv)
For water, FF is approximately 0.96.
ΔPmax ≈ 4.9 bar
Critical downstream pressure ≈ 5.1 bar(a)
If downstream pressure falls below the critical value, further pressure reduction may not increase flow and cavitation risk increases.
Gas Choked Flow Air or other gas with k ≈ 1.40 Upstream pressure: 8 bar(a)
Downstream pressure: 3 bar(a)
For an ideal gas, choking begins when:
P₂ ÷ P₁ ≤ [2 ÷ (k + 1)]k/(k−1)
Critical ratio ≈ 0.528
Actual ratio = 0.375
Flow is choked.
Once choked, reducing downstream pressure further does not significantly increase mass flow under unchanged upstream conditions.
Valve Travel Typical operating-point check Calculated required Cv: 30
Selected valve rated Cv: 60
Approximate capacity utilization = 30 ÷ 60 × 100% Capacity utilization ≈ 50% A valve operating near the middle of its travel range is often easier to control than one that is nearly closed or fully open.
Valve Characteristic Equal-percentage characteristic Commonly considered for wide load ranges and pressure-dependent systems. Each equal increment of travel produces approximately the same percentage change in flow coefficient. Useful for broad turndown requirements. The installed characteristic depends on both the valve characteristic and the pressure losses in the connected piping.
Cavitation Check Liquid service with high pressure recovery High upstream pressure, low downstream pressure, and a liquid vapor pressure that may be approached locally. Compare the actual pressure drop with the valve's allowable liquid pressure-drop limit using the valve recovery factor and vapor pressure. Cavitation may occur if local pressure falls below vapor pressure and bubbles subsequently collapse. Possible remedies include reducing pressure drop per stage, using an anti-cavitation trim, or changing the process arrangement.
Required Sizing Inputs Minimum data set for practical sizing Fluid type, flow range, inlet pressure, outlet pressure, temperature, specific gravity or density, viscosity, and vapor pressure. For gases, also include molecular weight or specific heat ratio, compressibility, and absolute pressures. Complete process data enables a more reliable valve and trim selection. Use maximum, normal, and minimum operating cases rather than sizing only for one flow point.
Note: Cv examples use US gallons per minute and psi for liquid service. Gas calculations require absolute pressure, and final valve selection should include applicable standards, noise limits, velocity limits, actuator requirements, and manufacturer-certified flow coefficients.

Performance Evaluation: Rangeability, 3–15 psi Signals, and IEC 60534 Leakage Classes

A control valve regulates flow by converting a control signal into stem movement. In many pneumatic systems, a 3–15 psi signal represents 0–100% travel. However, this relationship depends on calibration, spring range, actuator friction, and positioner accuracy. A 9 psi signal should indicate roughly 50% travel, but field conditions can shift that point. ISA guidance treats rangeability as the ratio between maximum and minimum controllable flow, not simply the valve’s maximum Cv. Practical rangeability often falls near 10:1 to 30:1, although specialized trim can achieve higher ratios. The result changes with pressure drop, fluid viscosity, and installed piping.

IEC 60534-4 classifies seat leakage through standardized testing. Class I permits broad leakage, while Classes IV, V, and VI impose progressively tighter limits. Class VI testing uses air and a specified pressure, with allowable bubbles depending on port size. It is not a universal guarantee of zero leakage in service. The U.S. Department of Energy reports that compressed-air systems may consume about 10% of industrial electricity, making signal quality and air losses worth measuring. I would not accept a high rangeability claim without checking actual low-flow stability. Catalog numbers can look better than field performance.

Tips: Record upstream and downstream pressure during commissioning. Verify the 3–15 psi signal at the actuator, not only at the controller. Trend valve position against flow. If flow oscillates below 10%, inspect friction, oversizing, and leakage class selection. A smaller valve may control better. That detail is often missed.

Back to top